


Red Tape & Restrictions
DATA VISUALIZATION
Part One: Infographic Poster
DATA VISUALIZATION
Part One: Infographic Poster
This project had a simple premise: Find a data subset and translate it into a visual system that communicated the research behind it in a cohesive way. Both the data and the visual system would be presented in three parts: Infographic poster, 3D model study, and a conceptual exhibition. I chose to focus on abortion care in the United States, specifically on abortion care and how it affects the rate of women with children living in poverty. Restrictions on abortion care can make it difficult or impossible for women seeking abortion care to receive the care they need. Subsequently, states with more restrictions on abortion care have higher numbers of women with children living in poverty. Given the sensitive nature of the subject matter, I had to answer the question: How can I create a visual narrative that both effectively displays the data and showcases its impact?
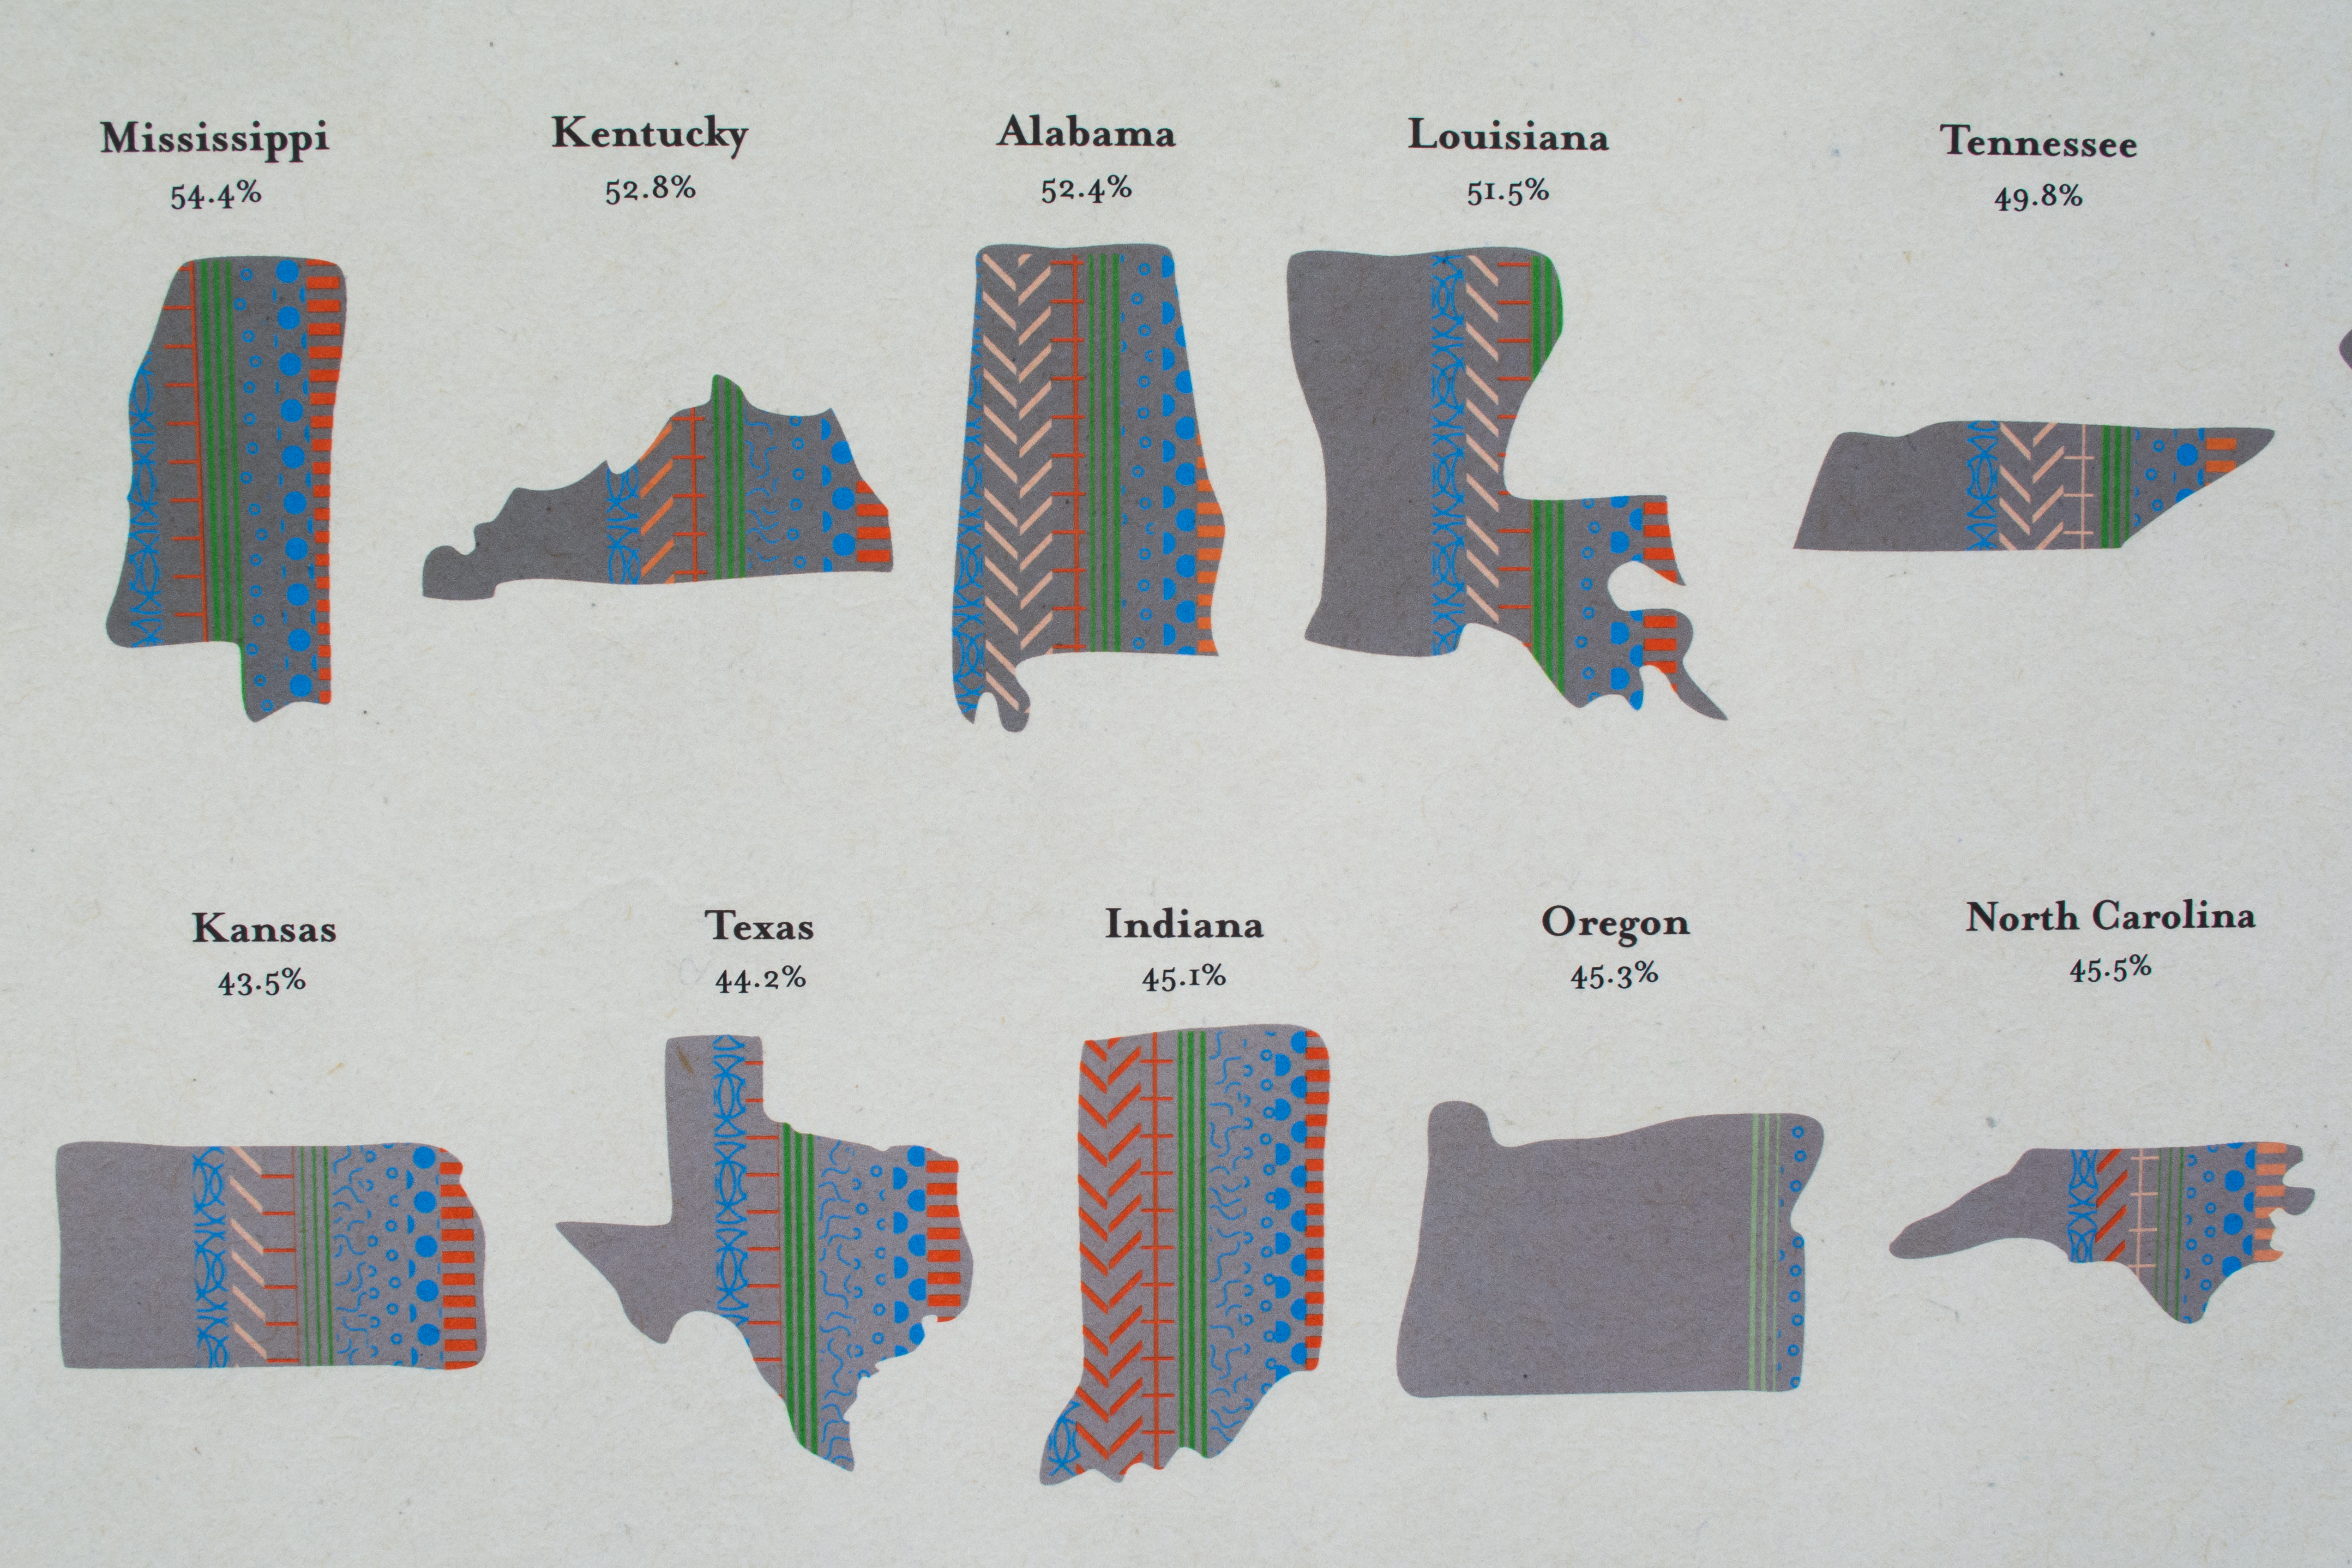
To counter the complicated nature of the data, I stove to keep the graphical elements of the poster clean and free of embellishments. The background is a simple paper texture, inspired by the paperwork a woman seeking abortion care would need to fill out. The primary colors are limited to tones of red and gray, with supporting accents of green and blue. In the main infographic, states are organized from highest rates of women living in poverty (top-left) to lowest rates of women living poverty (bottom-right). The colorful pattern bands, or “ribbons,” on each state icon denote specific restrictions on abortions as listed in the key. If a restriction has multiple forms, they are displayed as a shade of the master color in the key. It is important to showcase the restrictions specifically rather than just by numbers as each type of restriction has effects on the quality of life of women in that state. Smaller infographics include supporting information to the topic such as averages of women denied abortion care and government poverty assistance usage by women who carried a pregnancy to term because they were denied a wanted abortion. The poster as a whole reveals through the data that states with more restrictions on abortions have more women living in poverty.
To counter the complicated nature of the data, I stove to keep the graphical elements of the poster clean and free of embellishments. The background is a simple paper texture, inspired by the paperwork a woman seeking abortion care would need to fill out. The primary colors are limited to tones of red and gray, with supporting accents of green and blue. In the main infographic, states are organized from highest rates of women living in poverty (top-left) to lowest rates of women living poverty (bottom-right). The colorful pattern bands, or “ribbons,” on each state icon denote specific restrictions on abortions as listed in the key. If a restriction has multiple forms, they are displayed as a shade of the master color in the key. It is important to showcase the restrictions specifically rather than just by numbers as each type of restriction has effects on the quality of life of women in that state. Smaller infographics include supporting information to the topic such as averages of women denied abortion care and government poverty assistance usage by women who carried a pregnancy to term because they were denied a wanted abortion. The poster as a whole reveals through the data that states with more restrictions on abortions have more women living in poverty.

Part Two: 3D Infographic Study
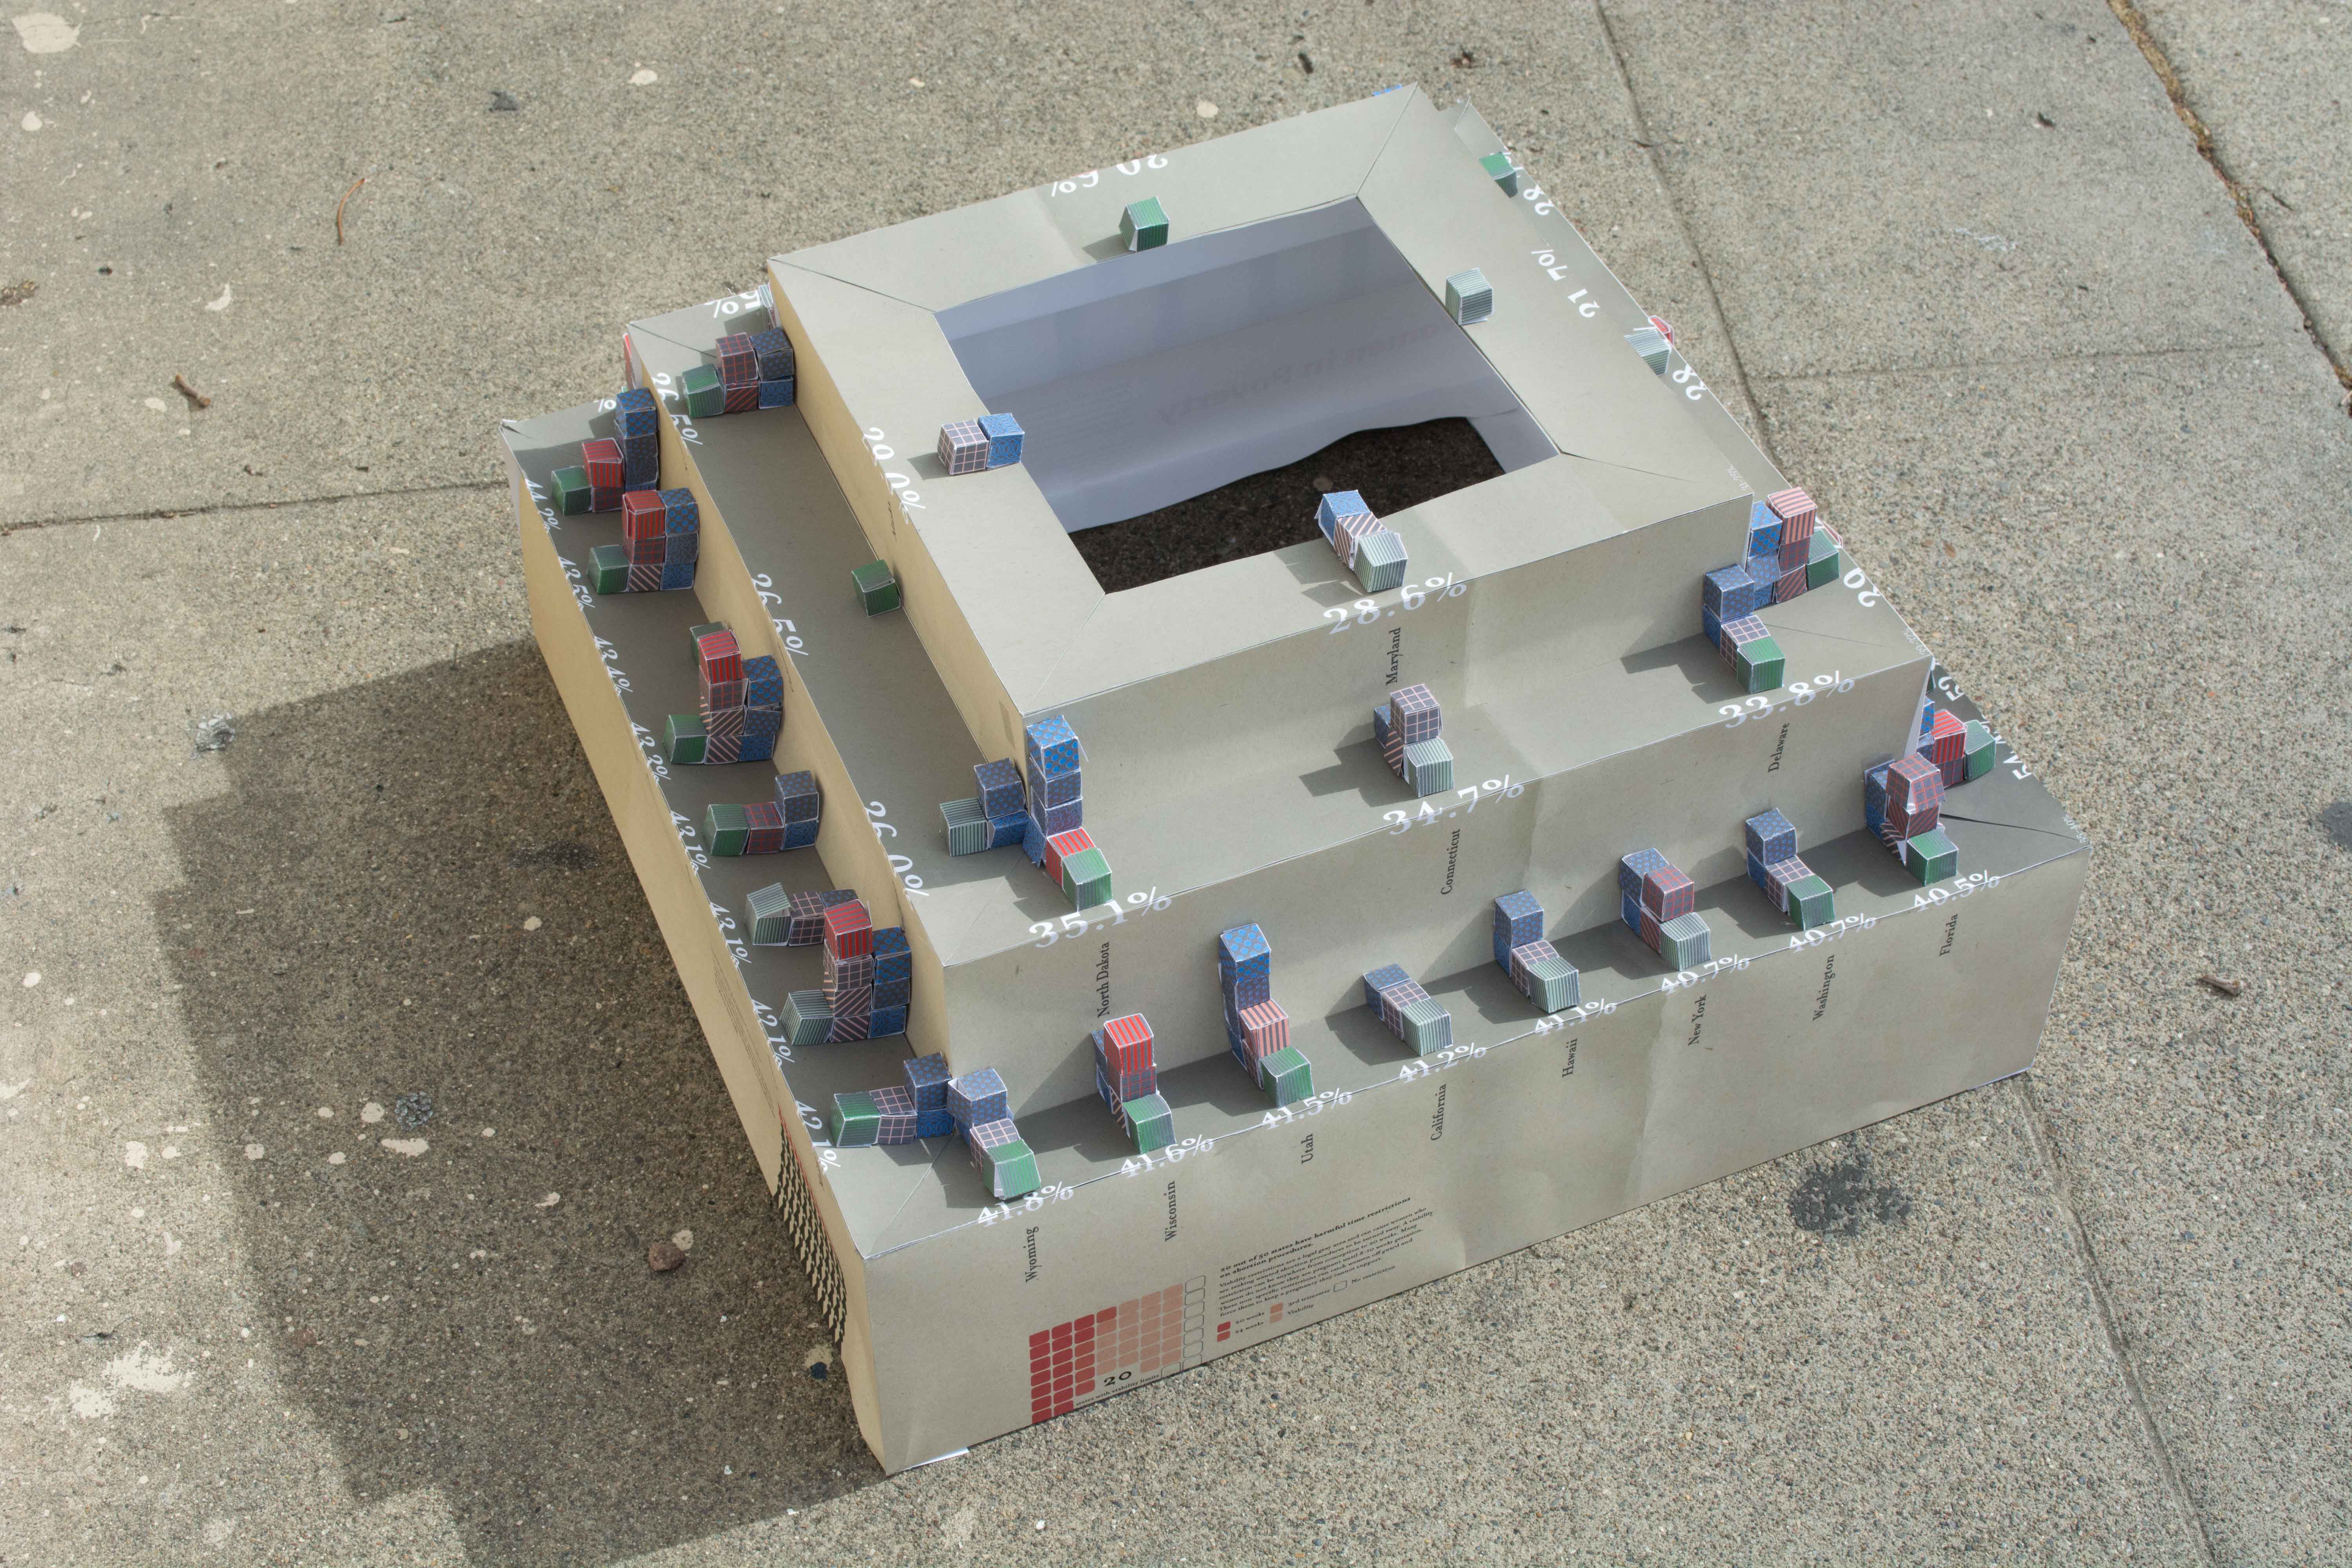
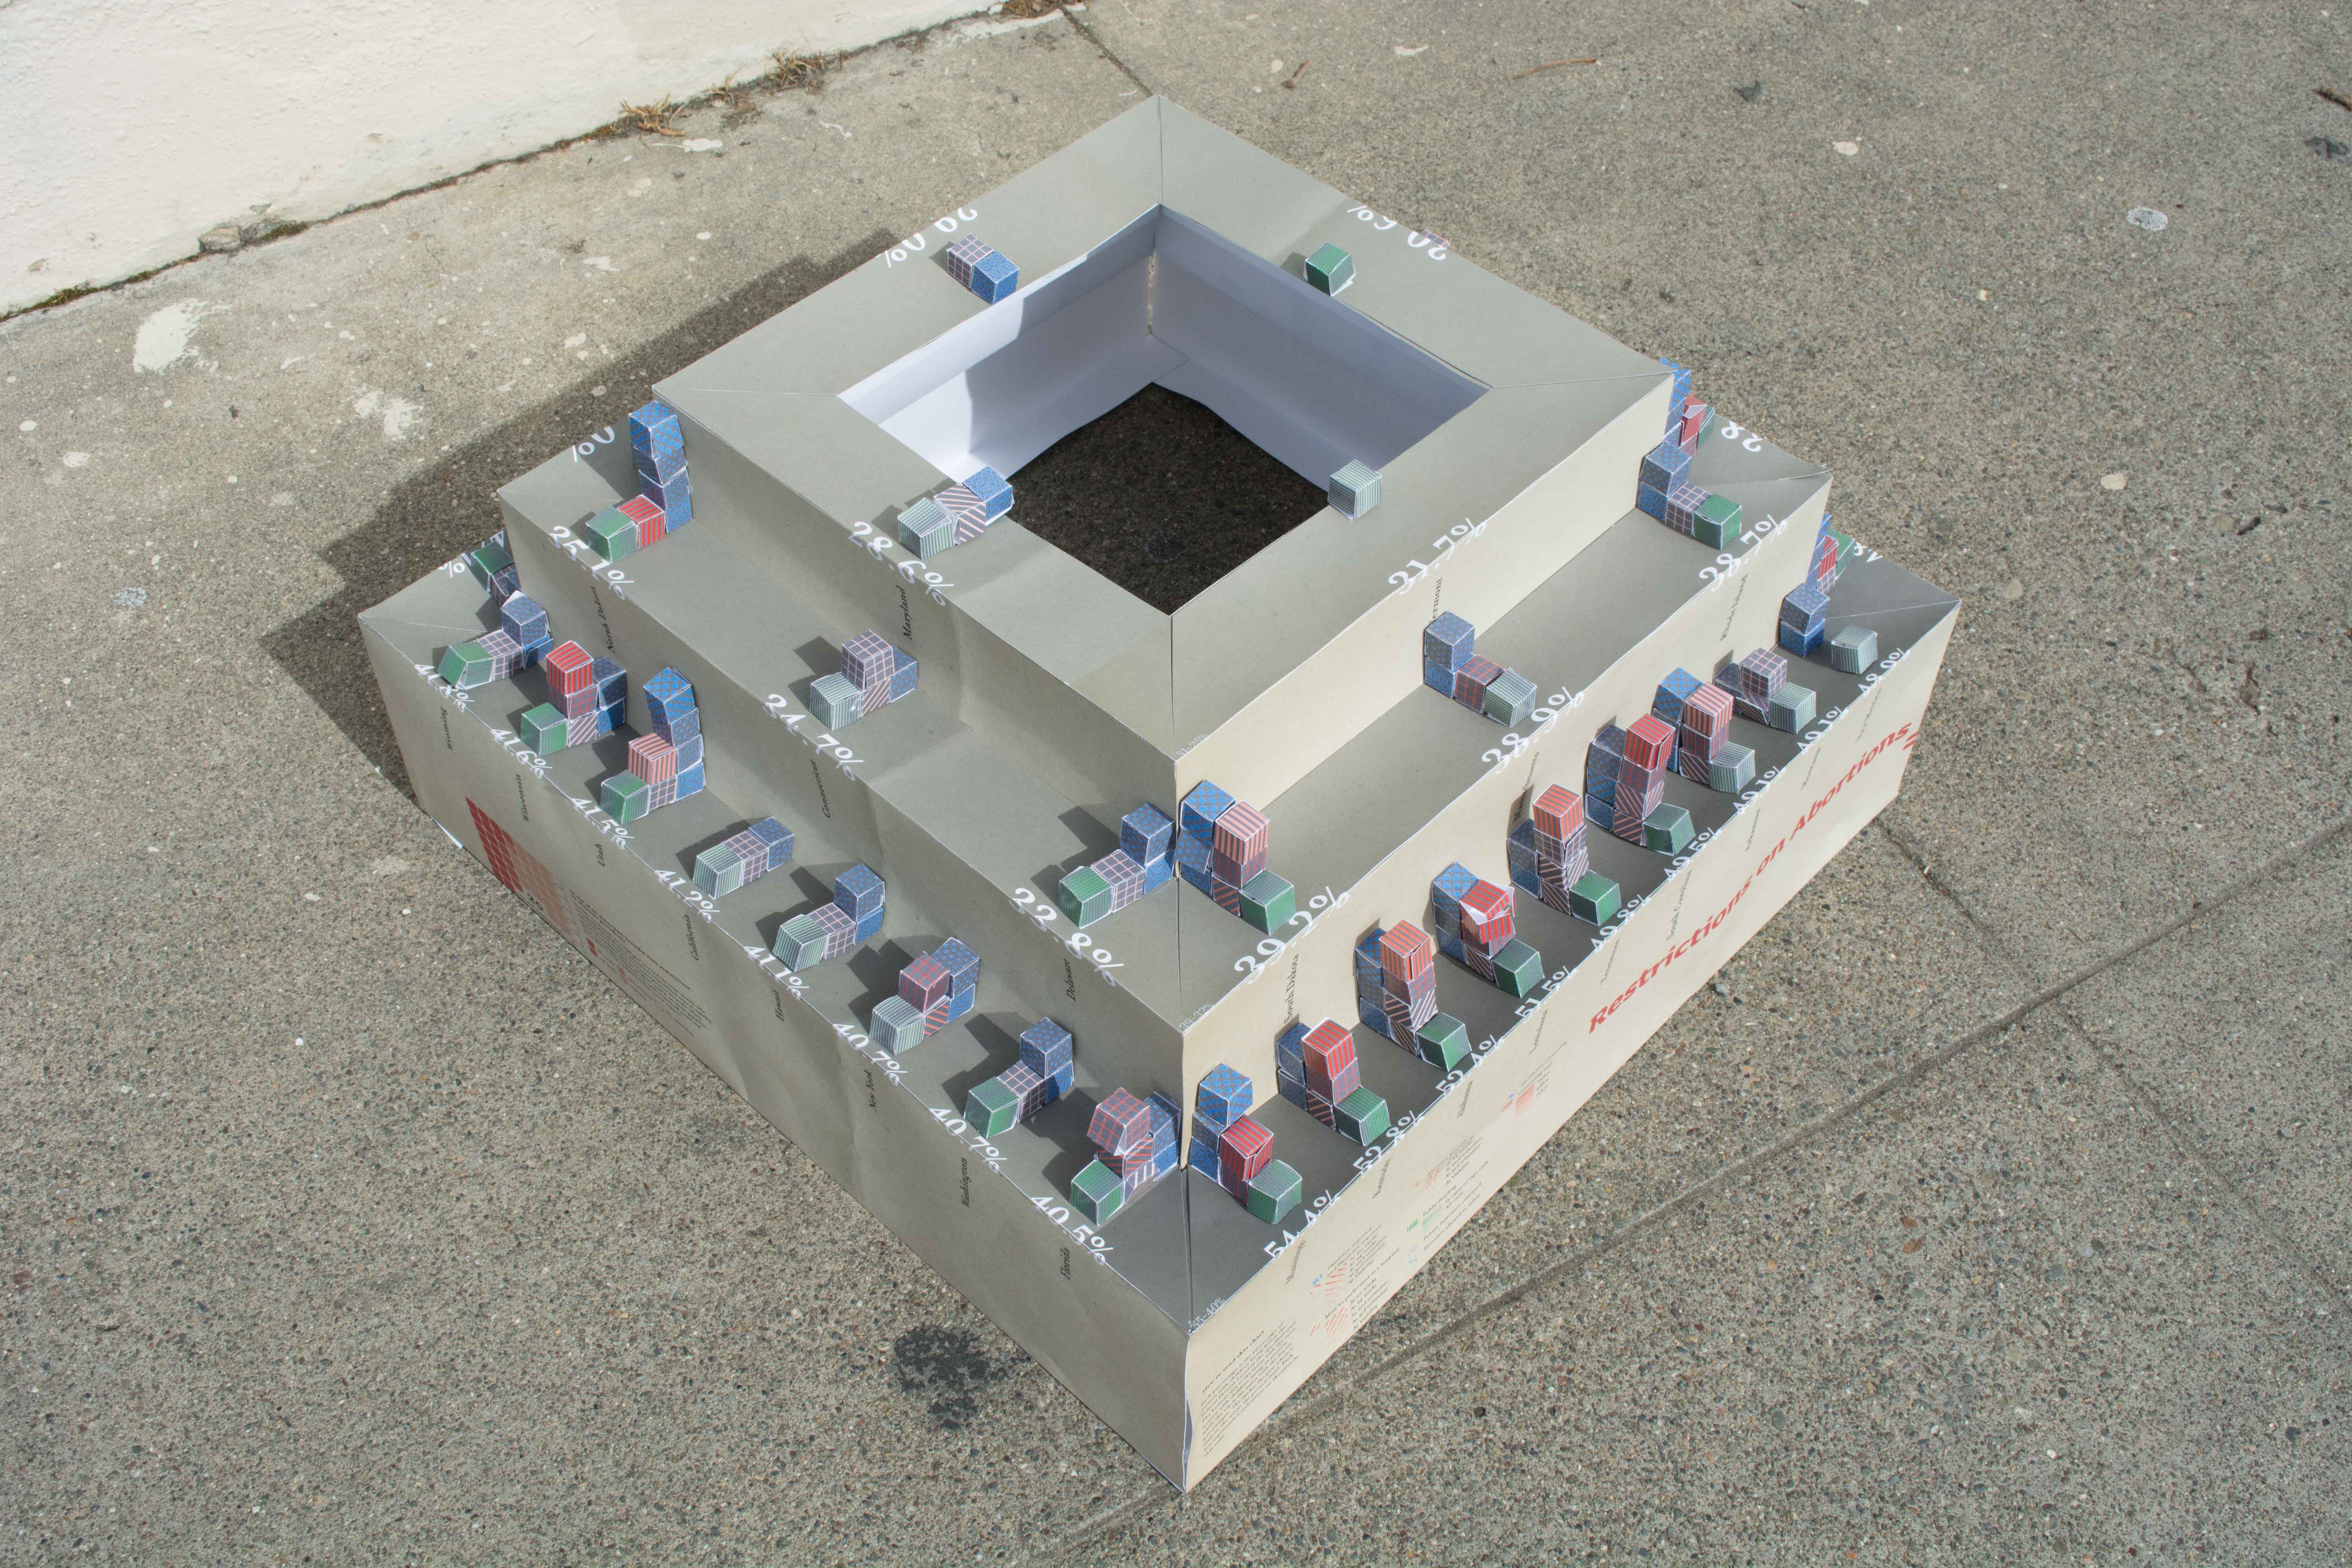
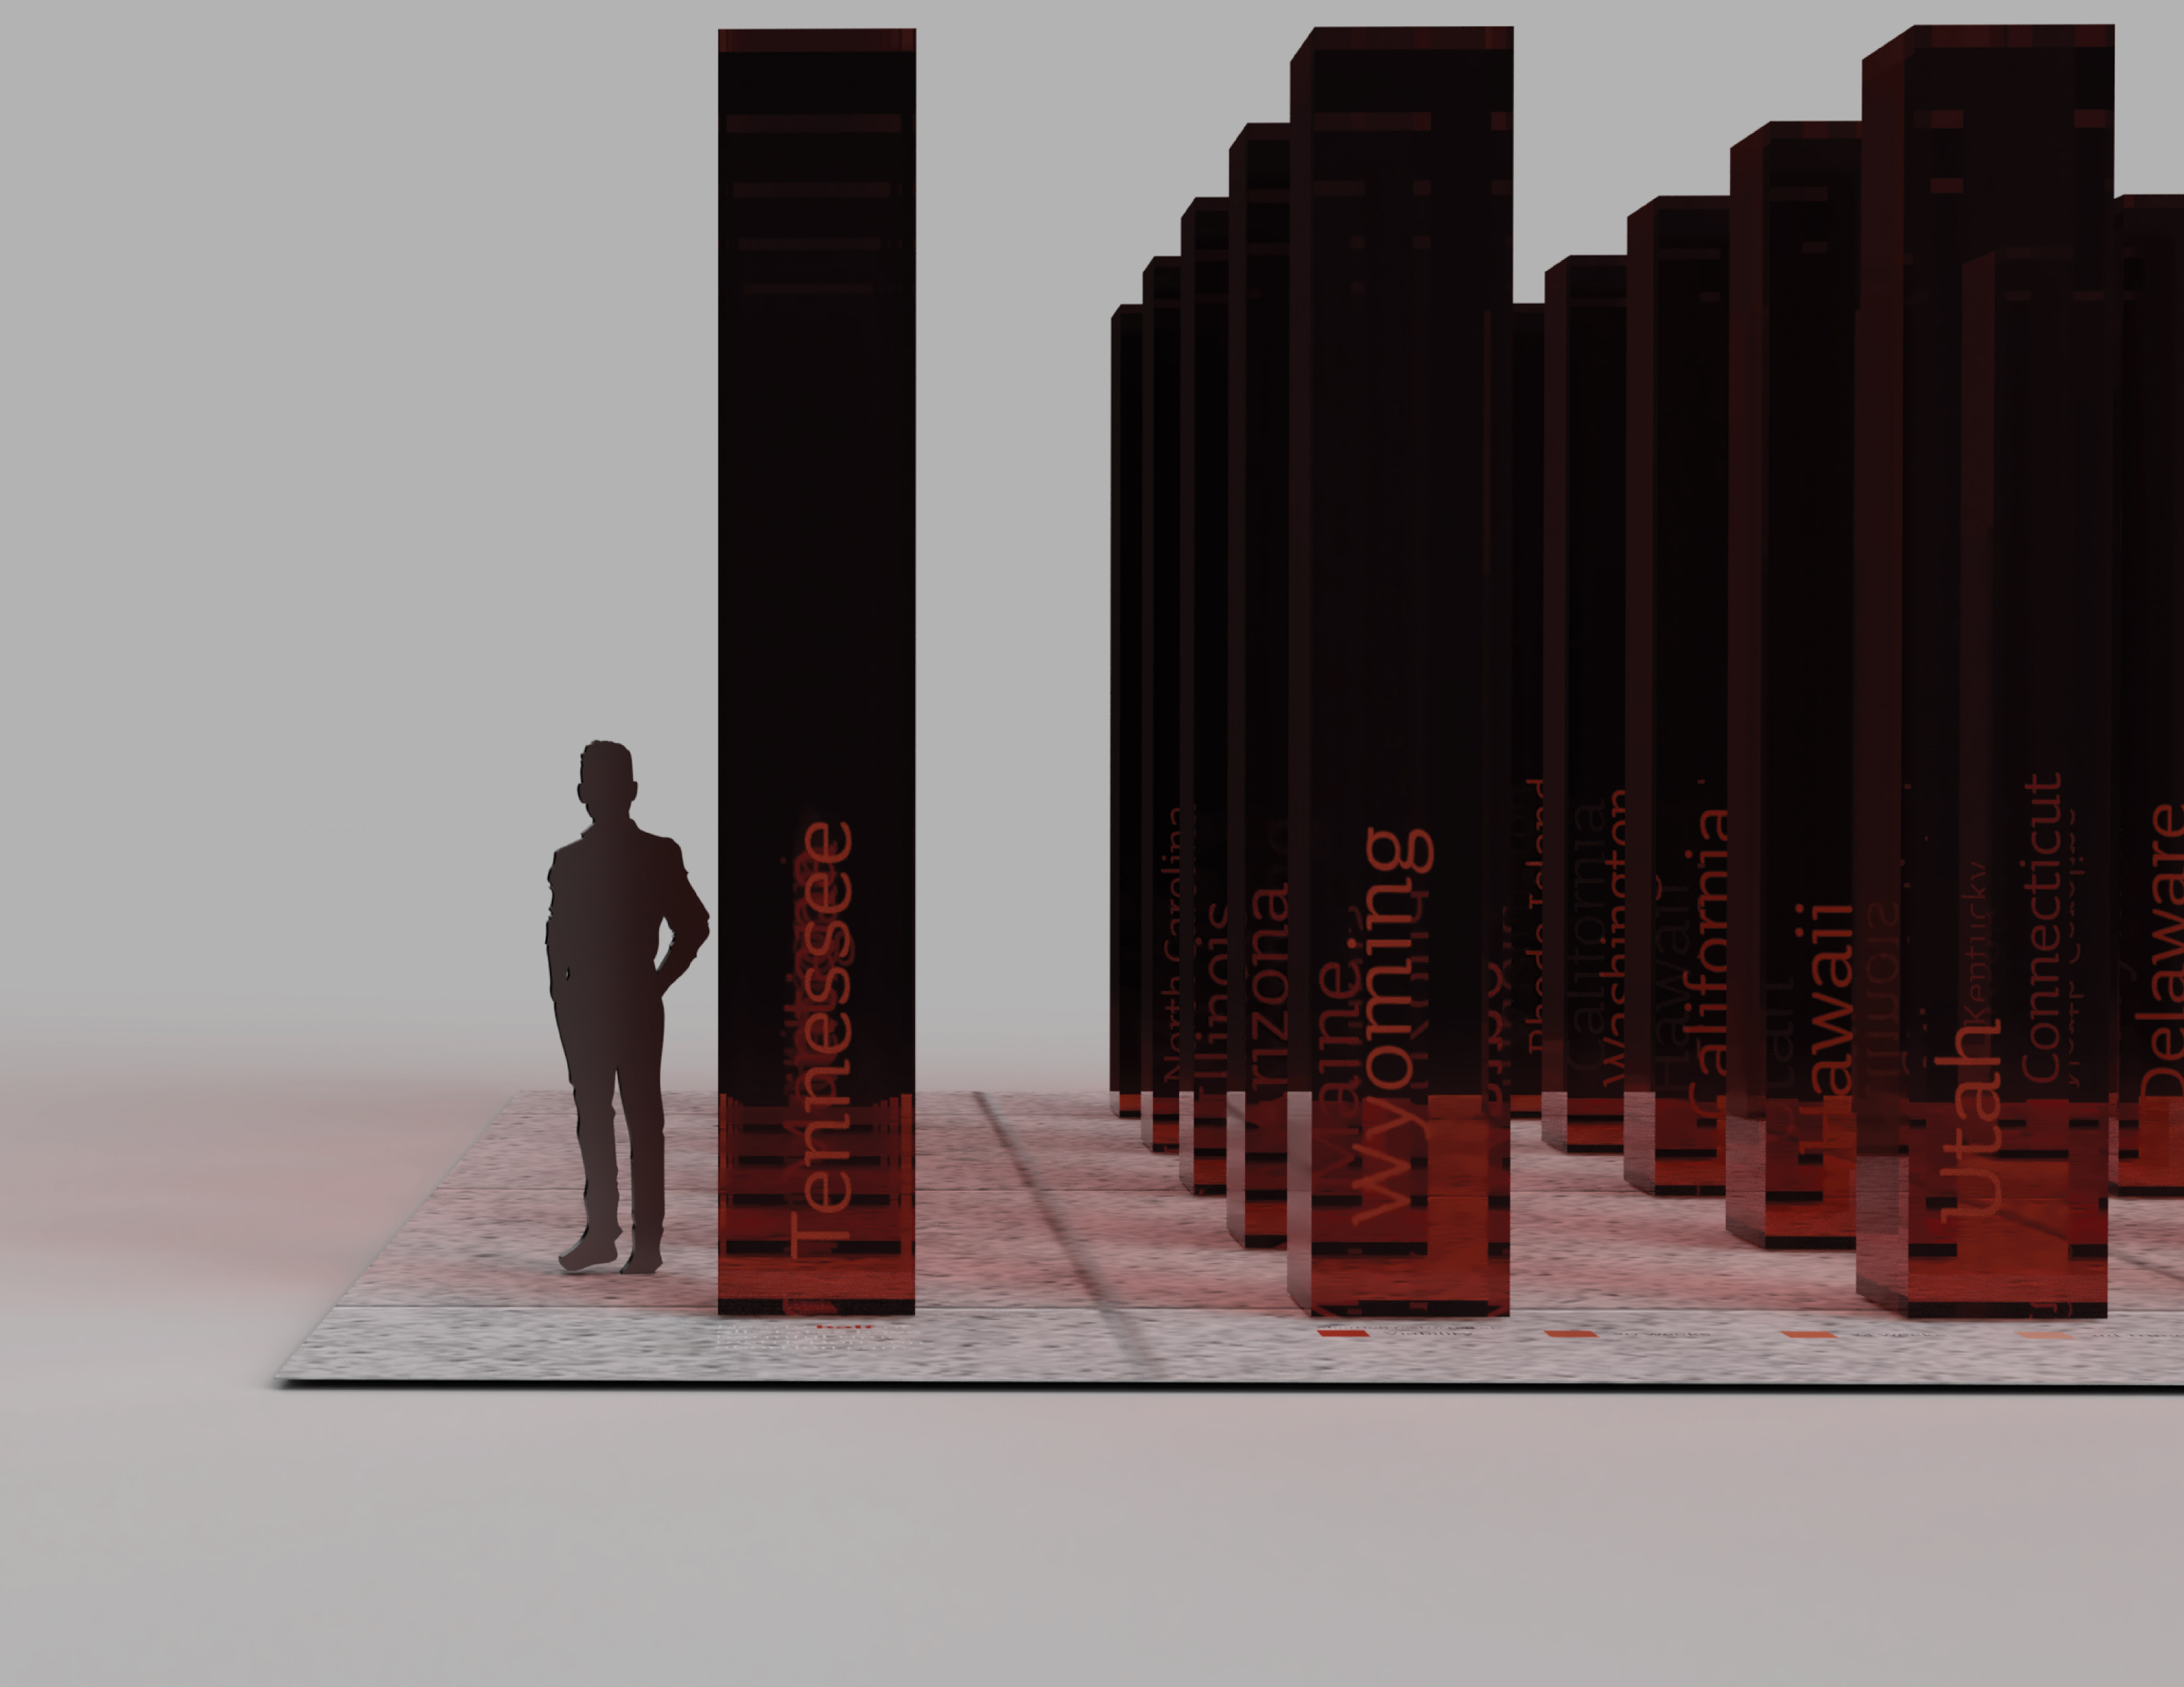
For this study, I translated the data from the infographic into a 3D form. My intention was to continue the narrative from the previous poster by creating visual weight with size, rather than color as it was done on the poster. I organized states into three tiers: the bottom (largest) tier displays states with the most women living in poverty, and the top (smallest) tier displays states with the fewest women living in poverty. Behind each state and its percentage of women with children living in poverty is the state’s restrictions. Each restriction was translated into a 1 x 1 inch box with the corresponding pattern from the infographic key on it. 346 individual boxes were made to represent abortion care restrictions. By viewing this model, the audience can visually see the disparity between states that have more restrictions and states with less restrictions on abortion care.


Part Three: Conceptual Space Design
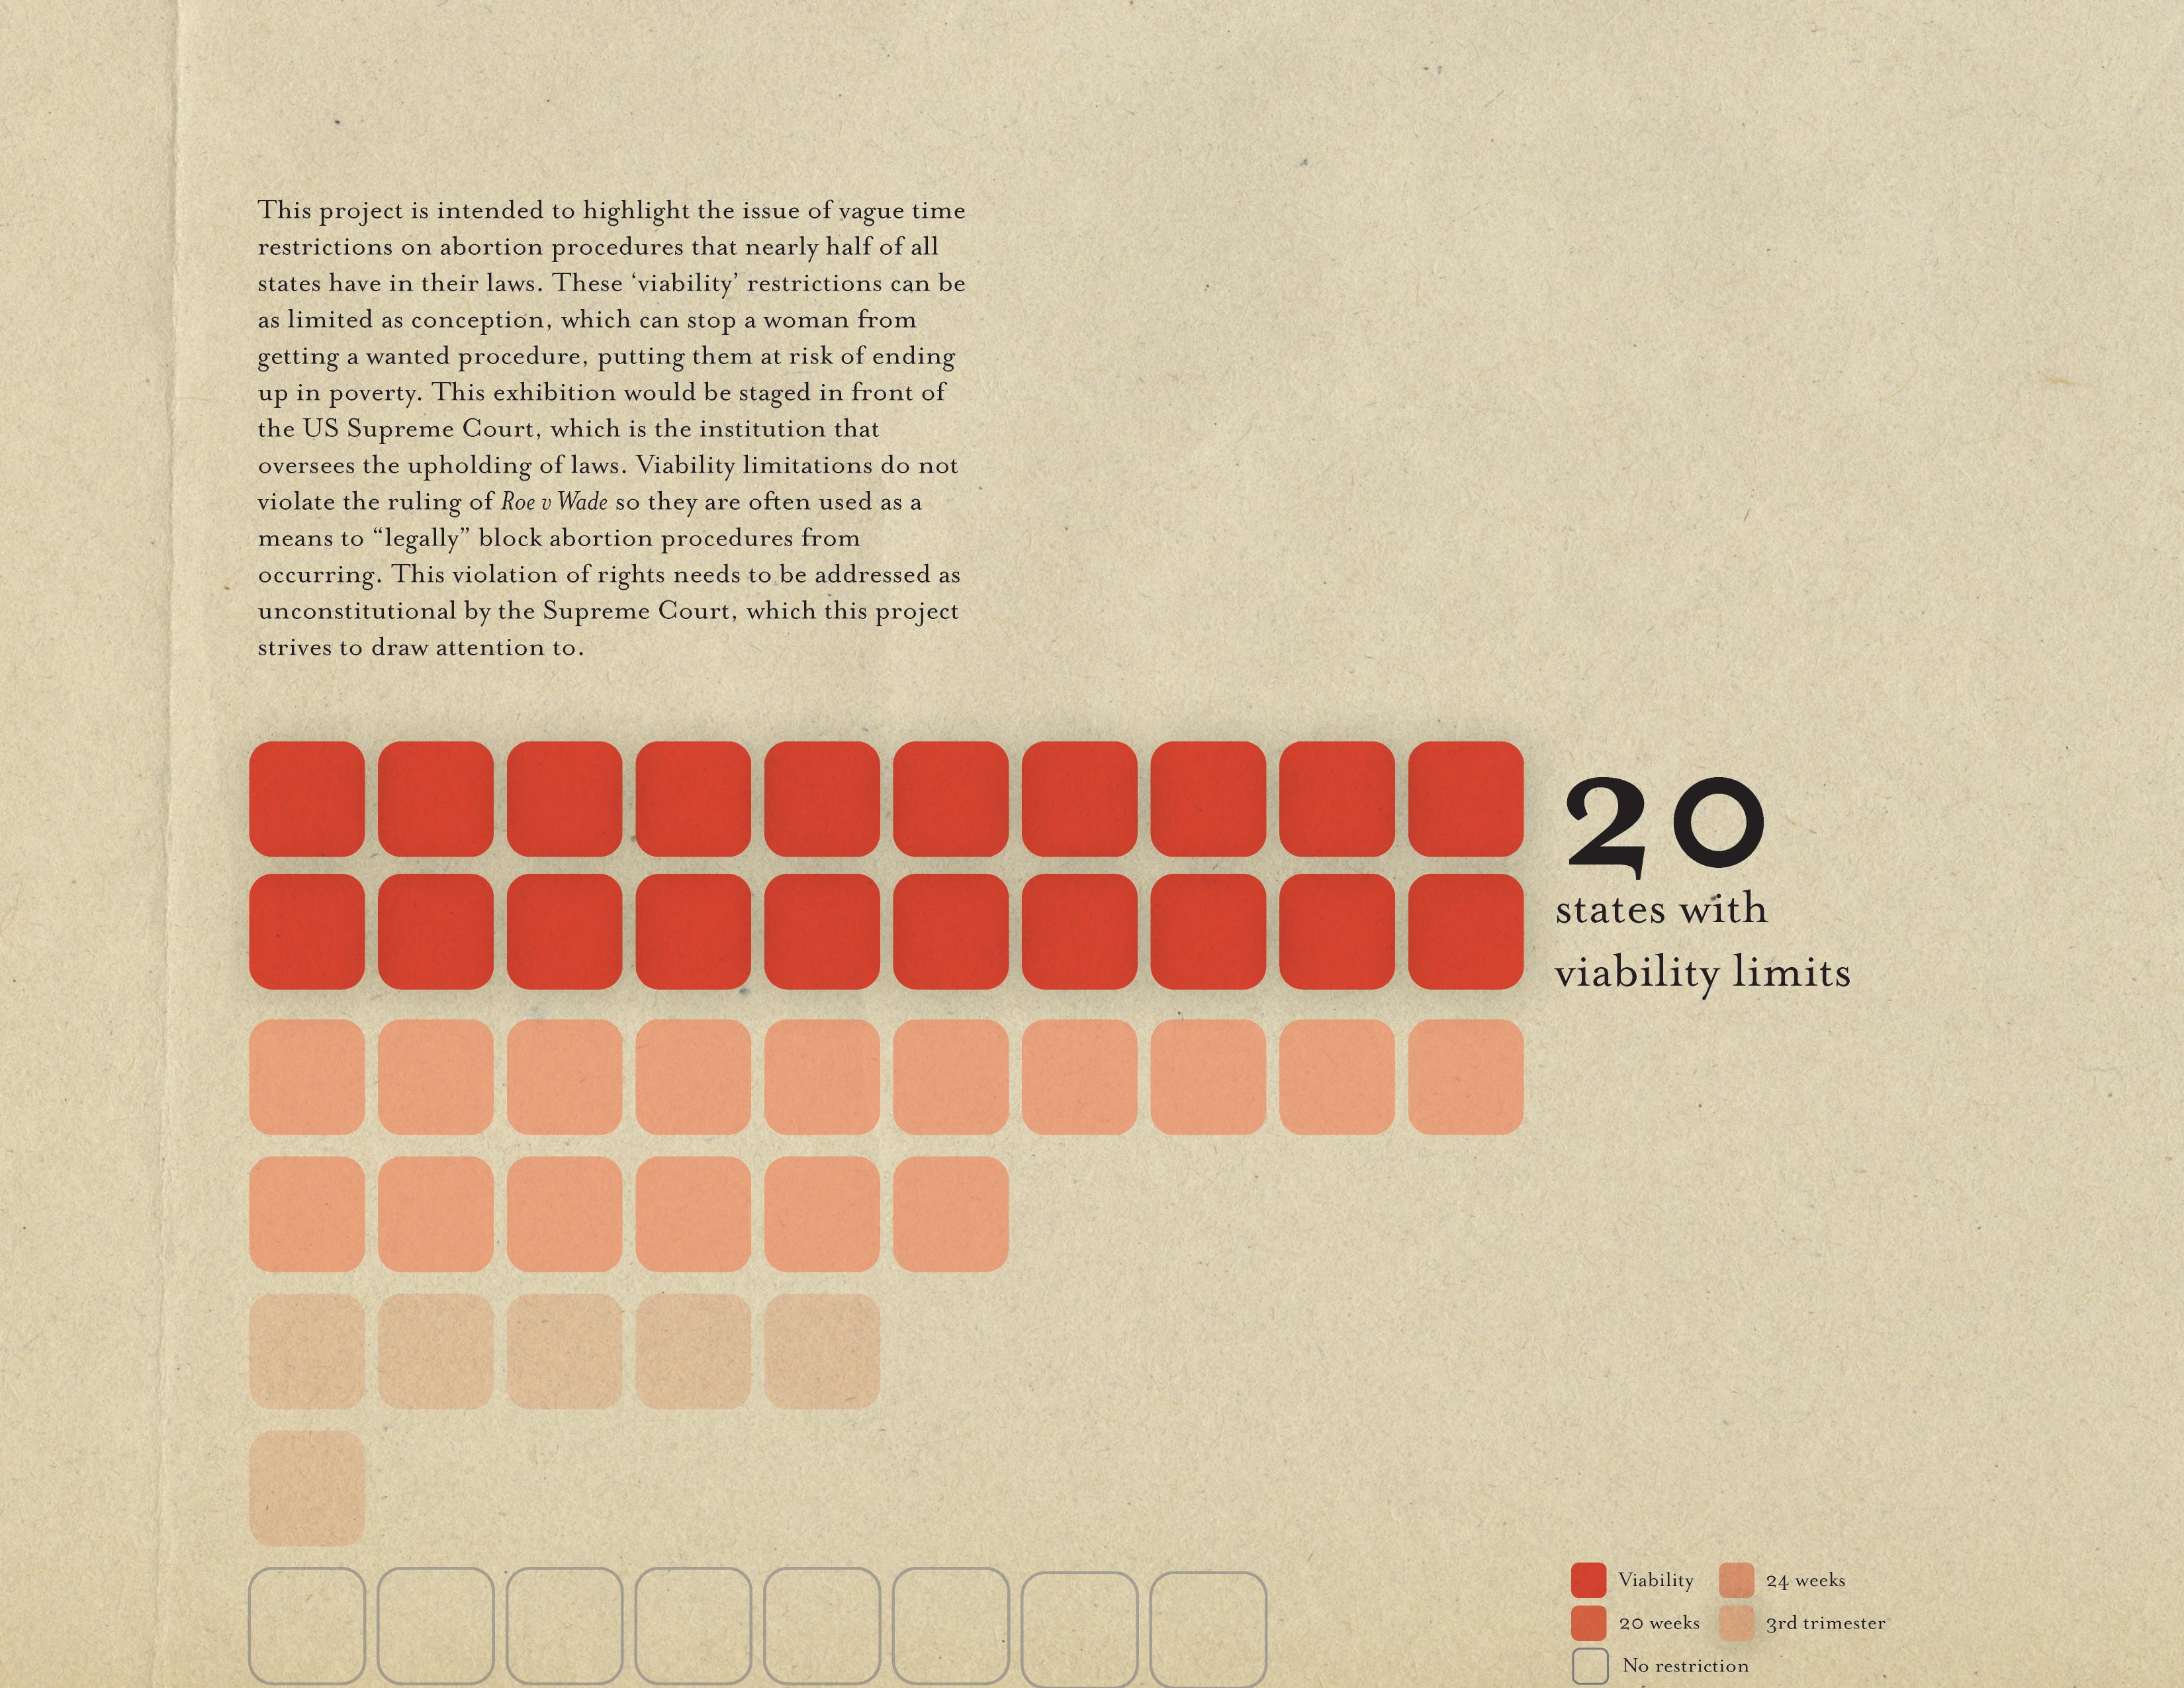
The final part of this project focused on a small subset of my overall data analysis: states with viability restrictions on abortion care. I took this data and translated it into a conceptual exhibition space. After conceptualizing the data in different forms, this final part of the project allowed me to give the narrative another dimension outside a paper form.
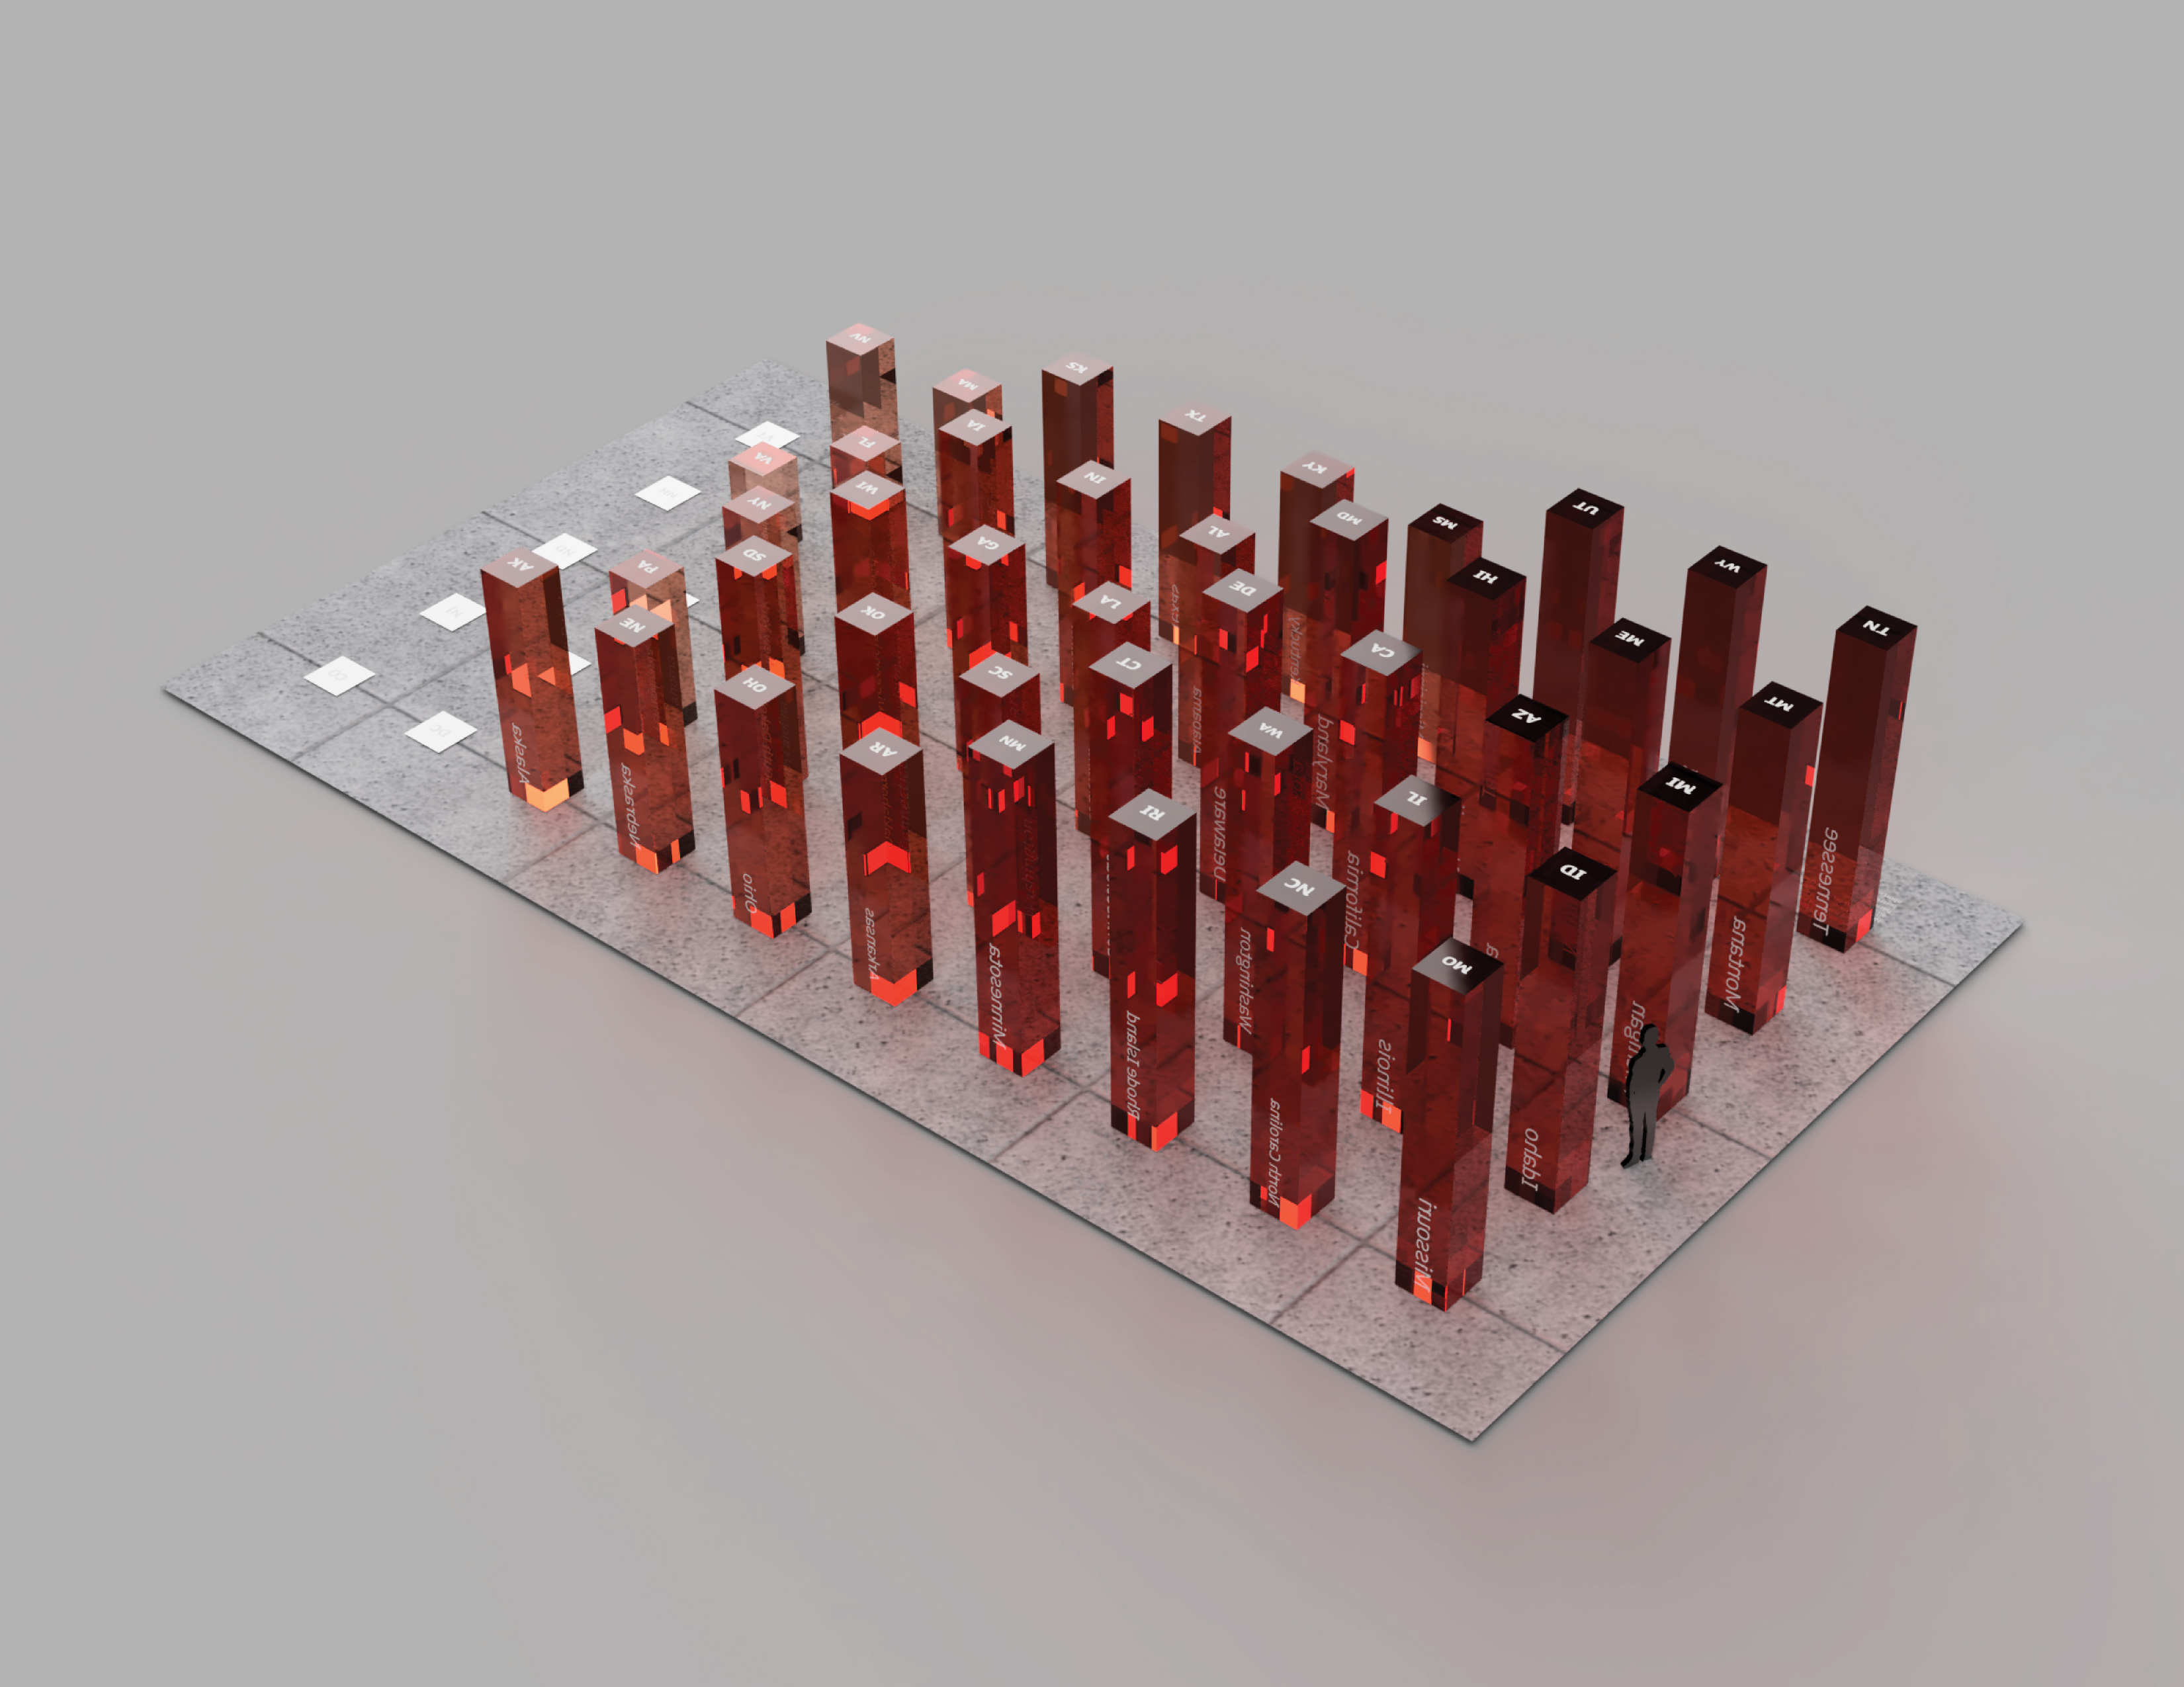
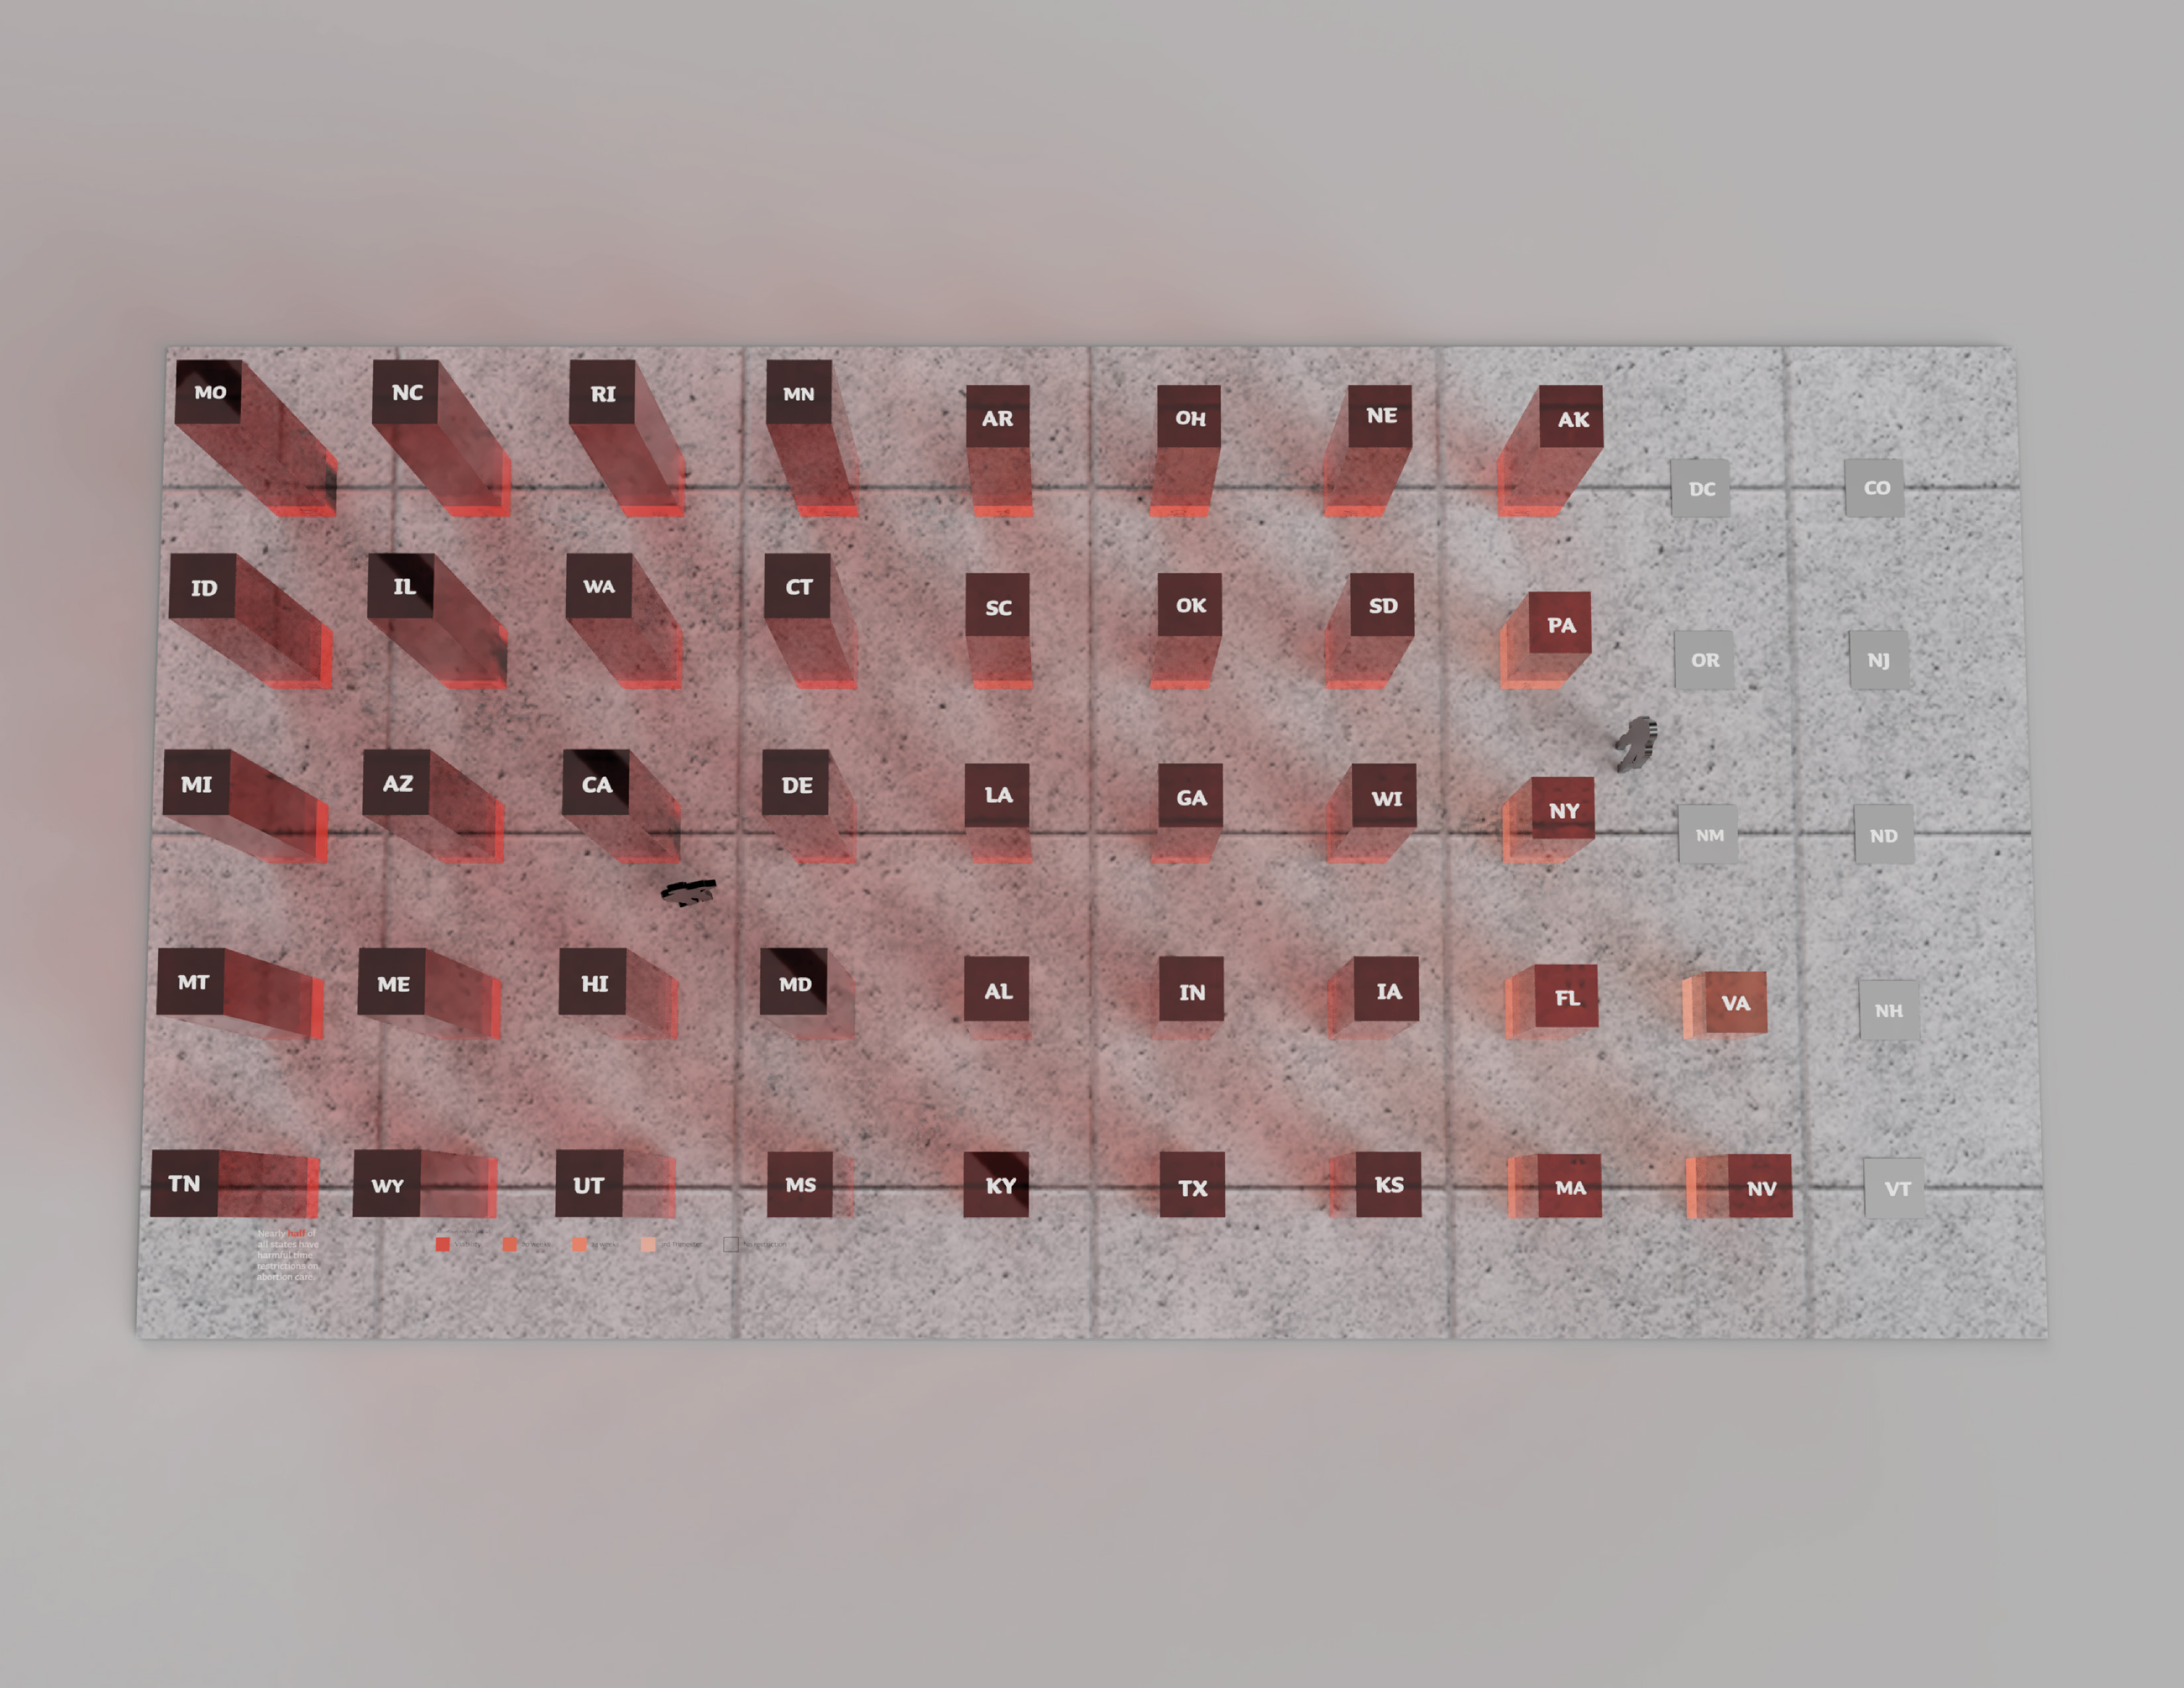
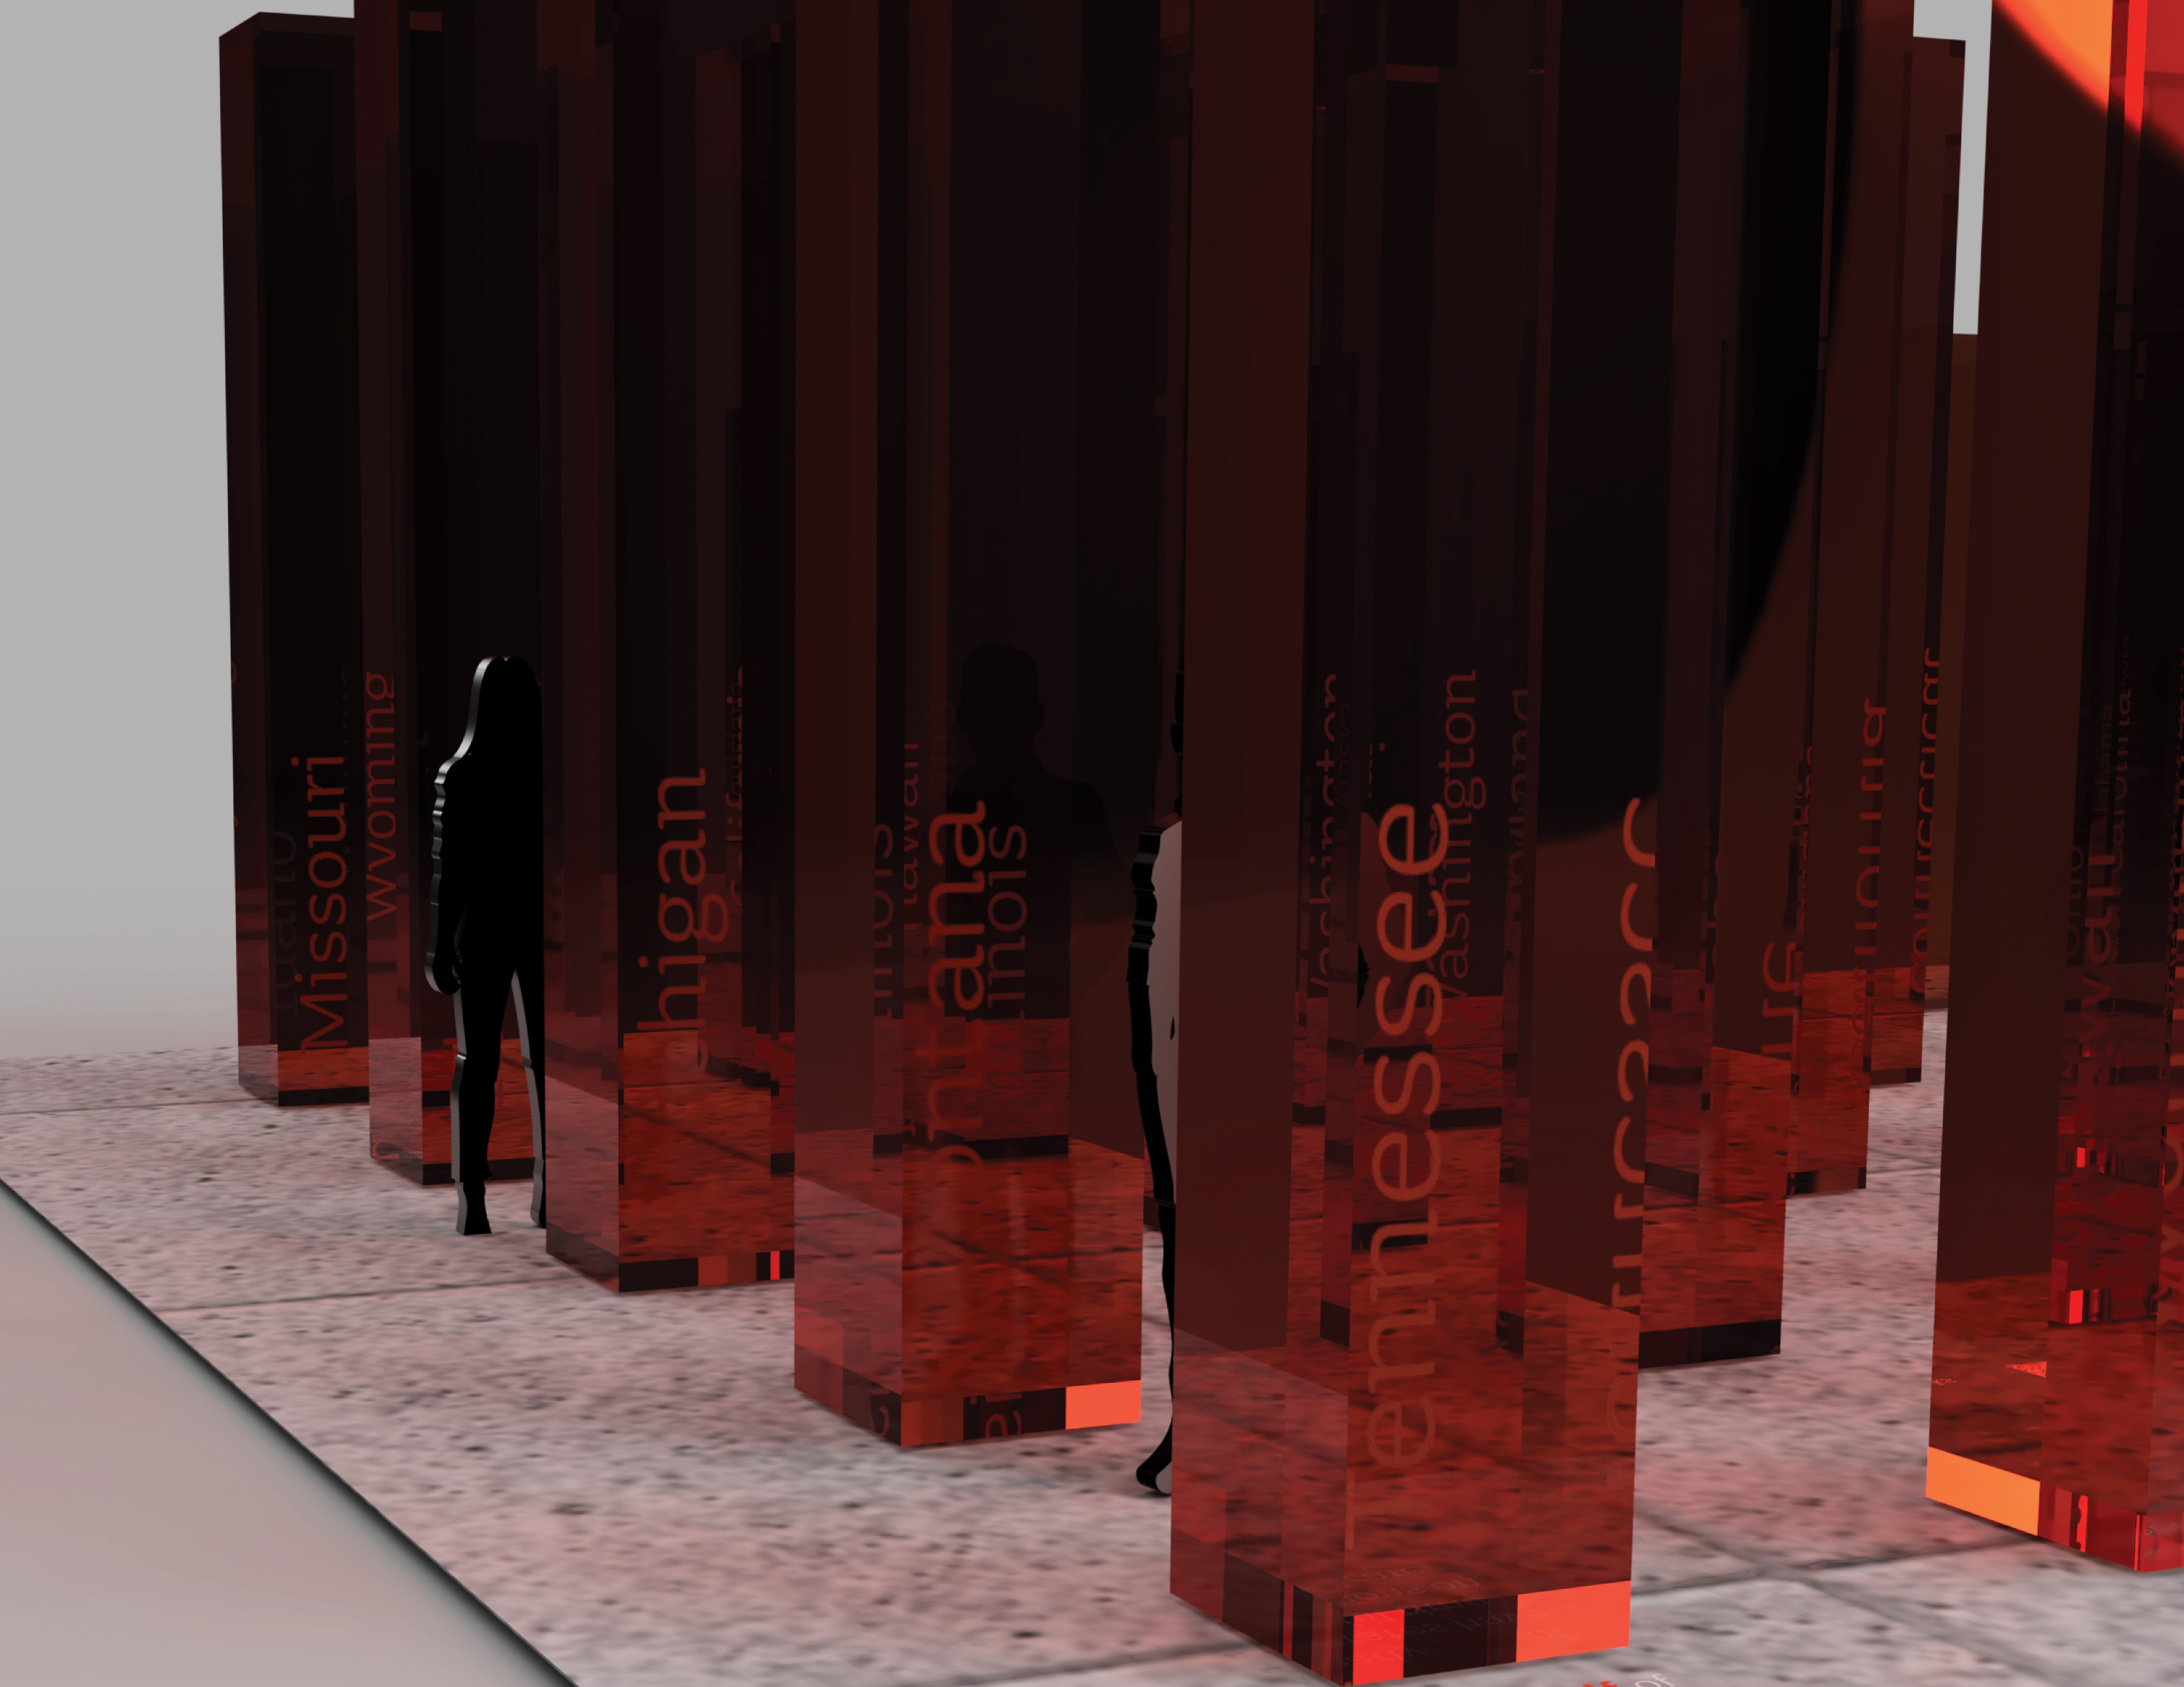
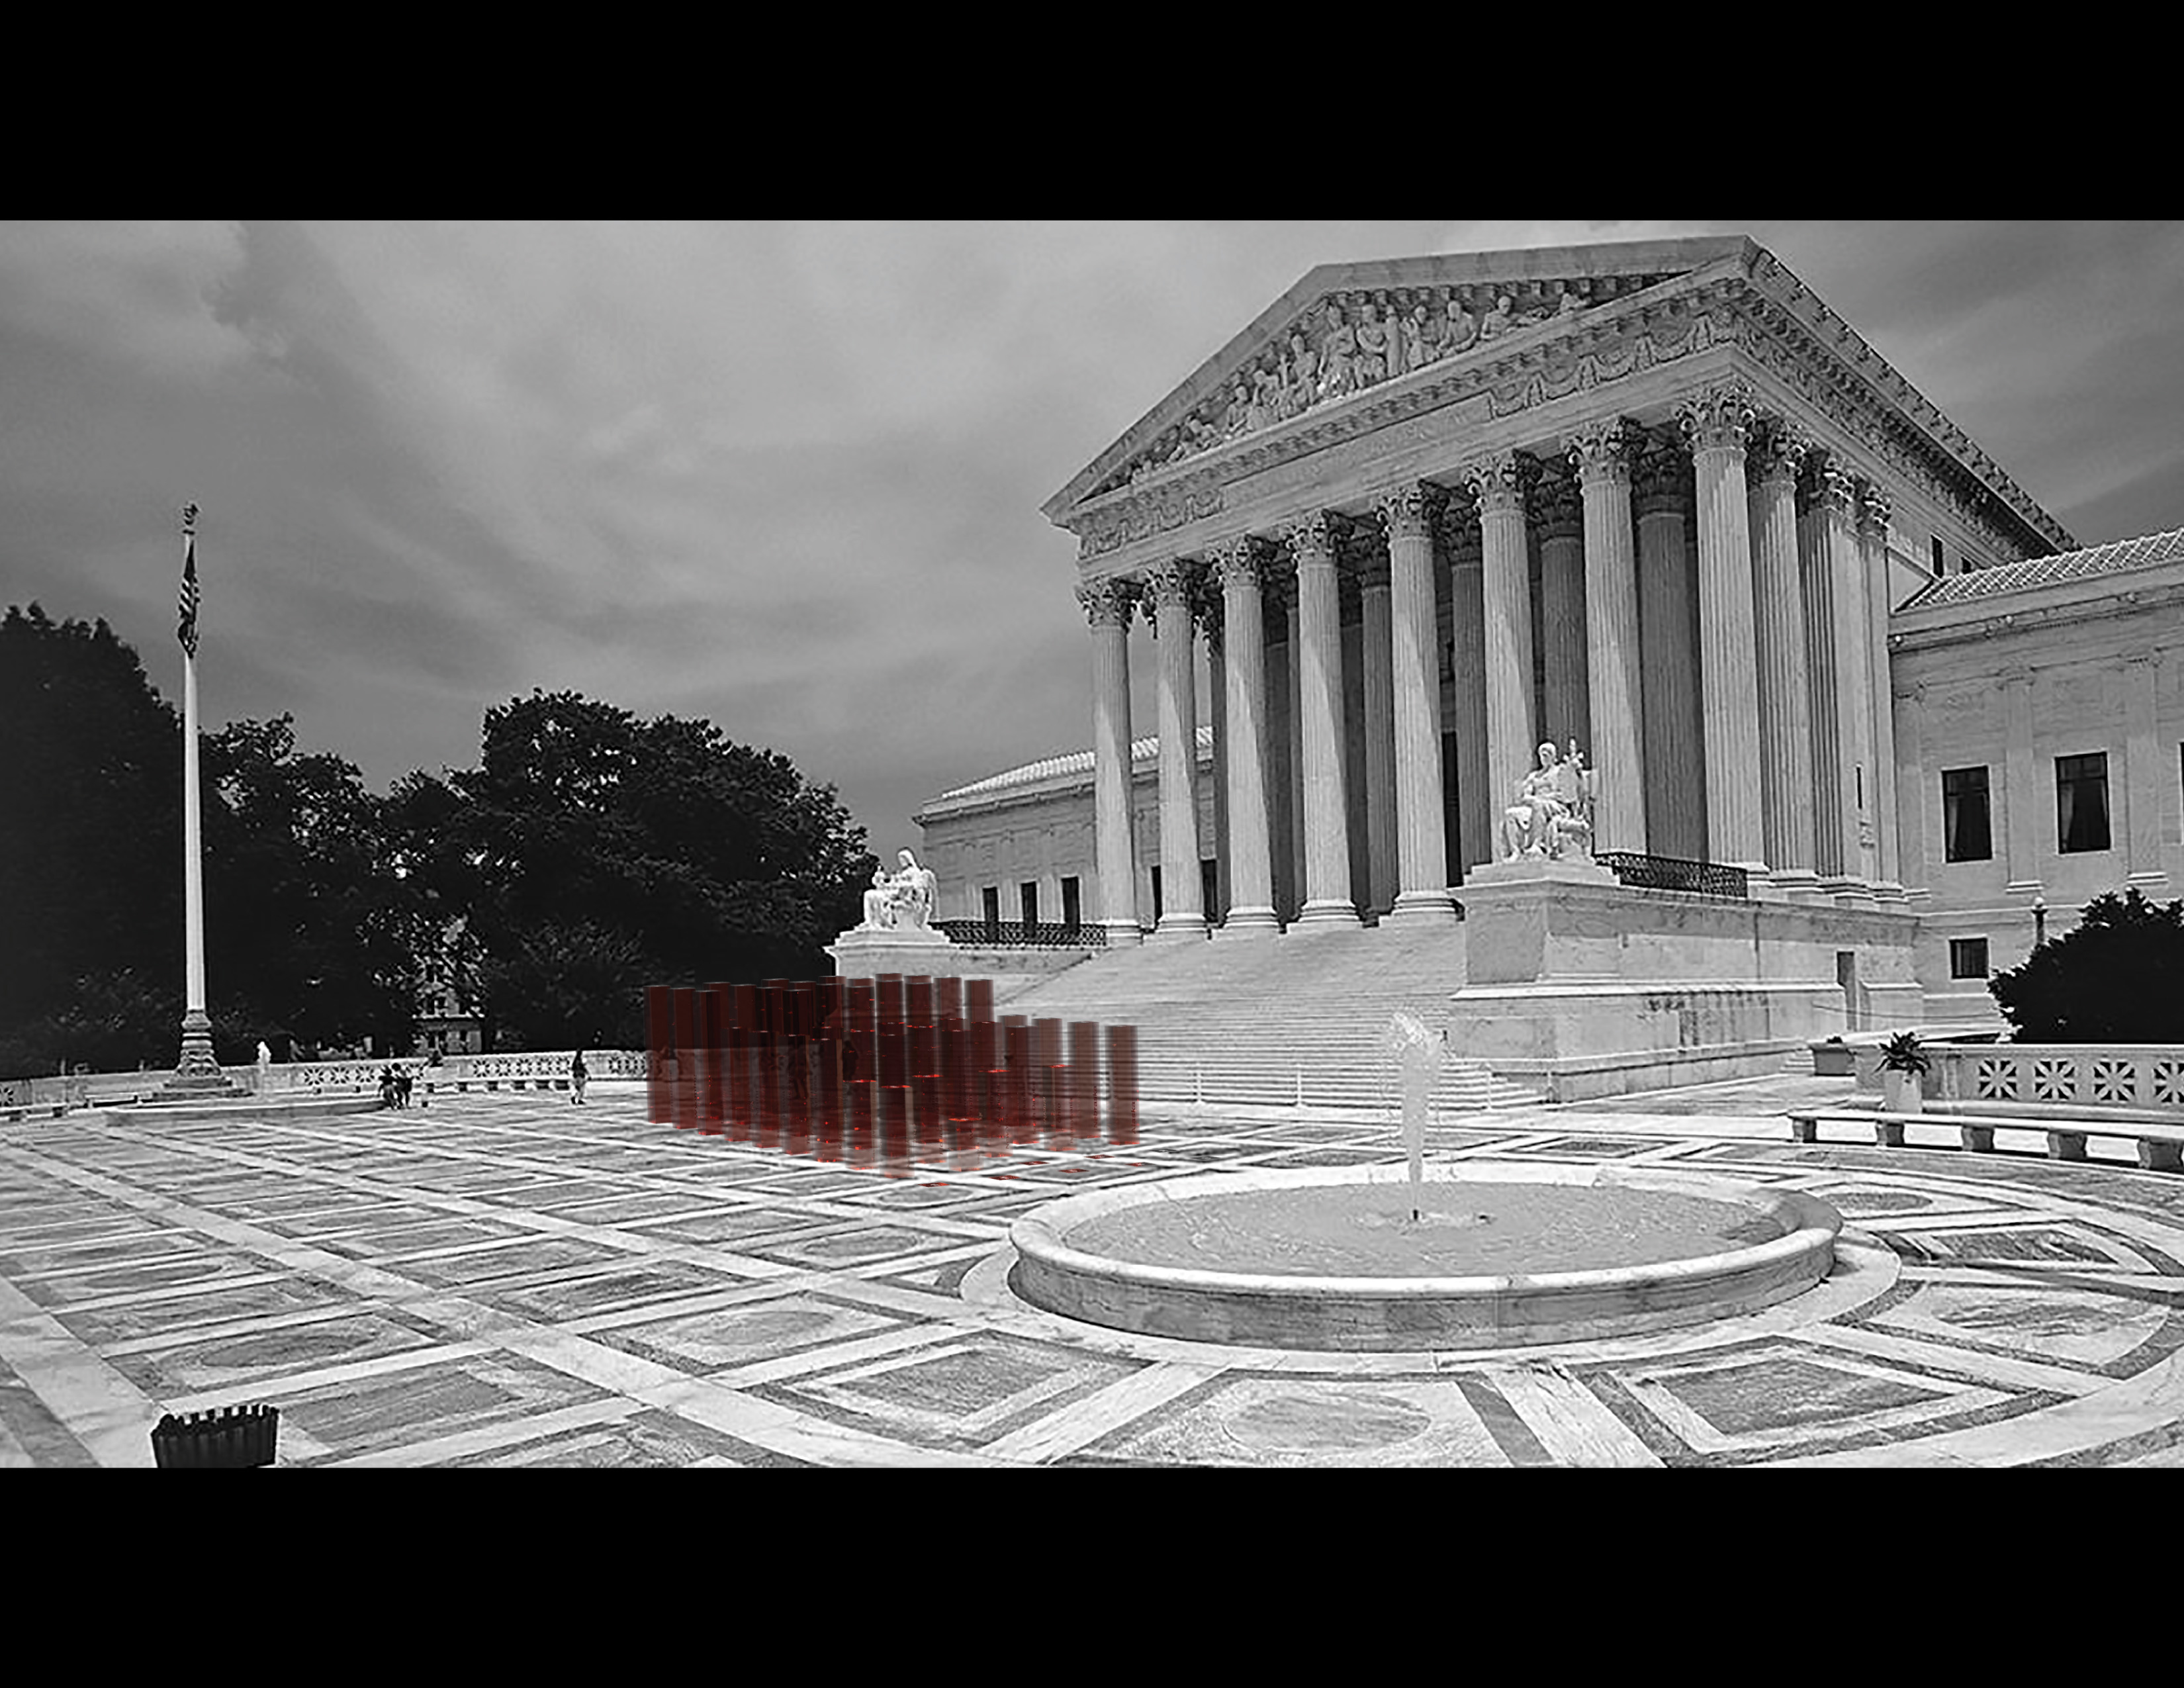
The 3D model for this project was created in Fusion 360. Each red toned pillar represents a state. Pillars are color and height coded based on the severity of their viability restriction, ranging from the tallest (most severe) to the shortest (no restrictions). This exhibition would take place in the courtyard of the U.S. Supreme Court, which is the institution that oversees the upholding of laws in the United States. Having this exhibition here would serve to draw attention to the magnitude of the problem that viability laws impose on women in poverty, and how these laws violate constitutional rights.
© Helen Frost ︎ ︎